High-voltage power lines and electromagnetic pollution – what’s new?
Changing demands on our energy supply require new power lines. This leads to changes in existing transmission line corridors and associated electromagnetic field levels. What building biology measurements have we seen in the field to date? And what can we expect in the coming years?
Historical background and EMF basics
Concerns about the health risks of electromagnetic fields started with observations and EMF measurements near high-voltage power lines, sparking the “electrosmog” debate. As early as in the 1960s and 1970s, increased rates of cancer or other diseases emerged in residents living near such power lines.
ELF magnetic fields, which are generated by current flows in power lines, have always been the focus. These types of fields easily penetrate building materials and houses, which is why indoor exposure levels are similar to ambient outdoor exposure levels. In most cases, shielding ELF magnetic fields is not feasible. There are numerous scientific studies on critical biological and health-related effects of ELF magnetic fields.
ELF magnetic field exposure levels have always fluctuated over time to a certain extent — though not significantly — mostly because of changes in the current flows of power lines, ranging from a few hundred to a few thousand amperes. From a building biology perspective, fields that fluctuate more strongly are more critical than uniform fields. (To date, extreme fluctuations of ELF magnetic fields have been observed especially near railroad systems, underground supply lines, and net currents in building wiring systems.)
In contrast, ELF electric fields produced by the voltage (110, 220, or 380 kV) of power lines behave differently. These fields tend to be conducted to ground by masonry buildings; they hardly ever penetrate inside buildings. If they do anyhow (such as in non-masonry buildings like wood frame construction and/or attics), they can usually be controlled by implementing specific shielding measures. (The success of correctly installed shielding measures should be verified by measurements.) ELF electric field levels show hardly any fluctuations over time.
In 2001, the World Health Organization (WHO) classified ELF magnetic fields as a Group 2B carcinogen, which means “possibly carcinogenic.” The classification was based on scientific studies that showed effects from field levels of 300 to 400 nT (3 to 4 mG). These type of exposure levels are not uncommon in the vicinity of high-voltage power lines. In our experience, ELF magnetic field exposure levels usually range from 200 to 1000 nT (2 to 10 mG) within 50 to 100 m (160 to 330 ft), also more or less depending on the situation. At closer range, they can also be as high as 10,000 nT (100 mG). As mentioned earlier, fluctuations at different times of the day were usually rather low: during high-exposure periods, exposure levels only were 2 to 4 times higher than during low-exposure periods.
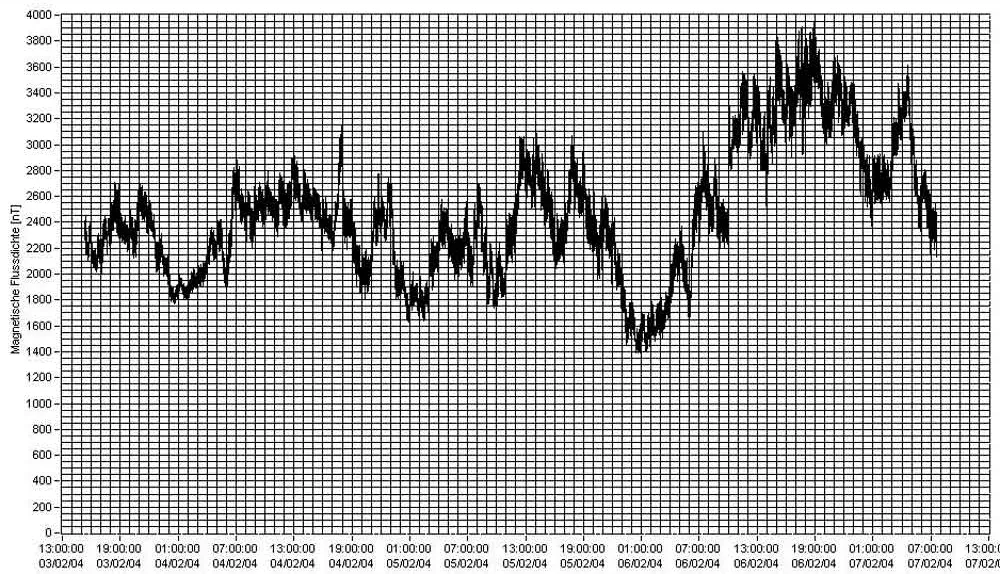
The time course of ELF magnetic field levels from a high-voltage power line in 2004 over 4 days with field levels between about 1400 and 3900 nT (14 and 39 mG) = factor 2.8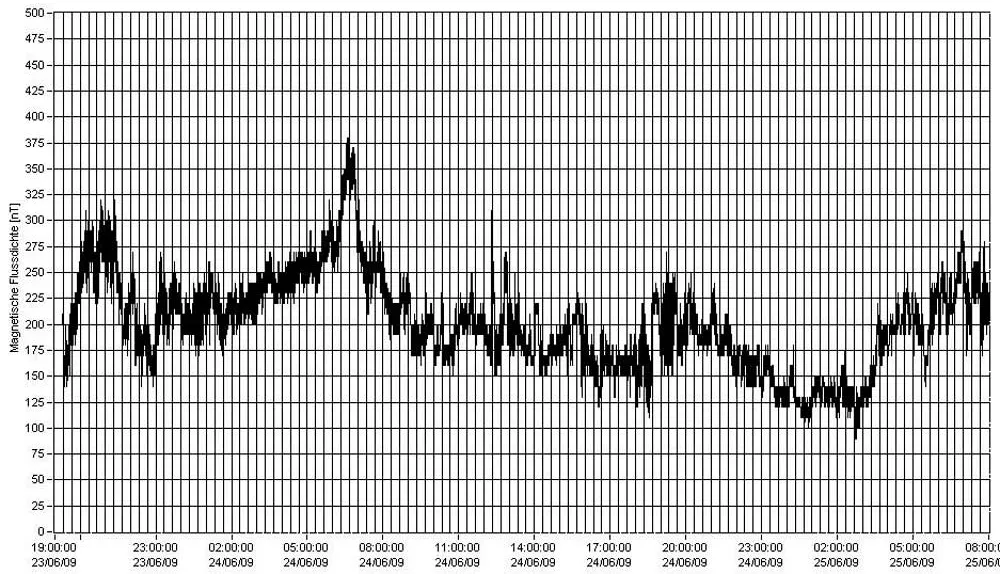
The time course of ELF magnetic field levels from a high-voltage power line in 2009 over 2 days with field levels between about 100 and 370 nT (1 and 3.7 mG) = factor 3.71 The time course of ELF magnetic field levels from a high-voltage power line in 2004 over 4 days with field levels between about 1400 and 3900 nT (14 and 39 mG) = factor 2.82 The time course of ELF magnetic field levels from a high-voltage power line in 2009 over 2 days with field levels between about 100 and 370 nT (1 and 3.7 mG) = factor 3.7
Current measurements
Since about 2015, our measurements near various high-voltage power lines have shown that the associated ELF magnetic field levels now fluctuate much more than before. Differences between minimum and maximum often are up to 10 times greater and the periods between lower and higher field levels are much longer. In addition, field levels often change quite abruptly over time, with actual jumps and no smooth transitions.
The graphs of ELF magnetic field levels below clearly illustrate these abrupt changes over time.
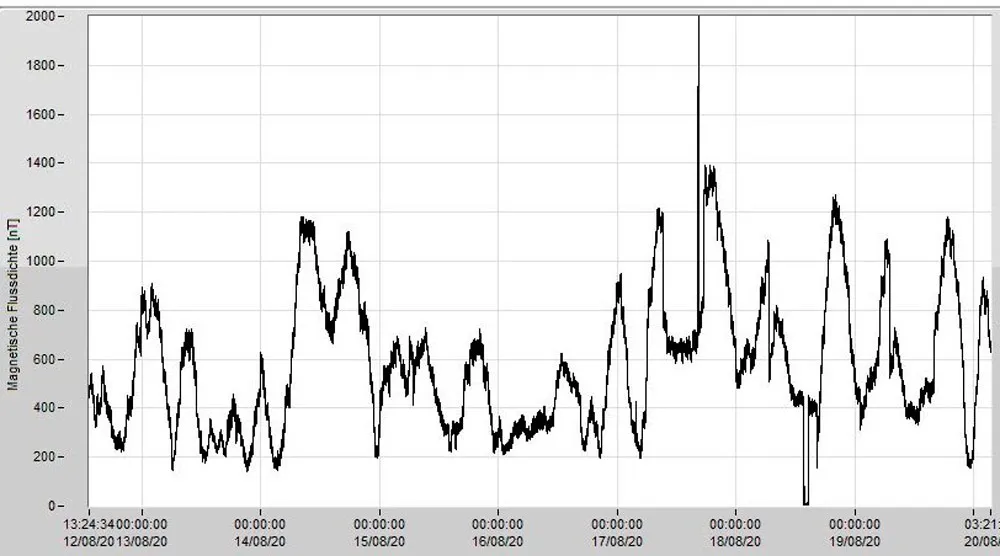
The time course of ELF magnetic field levels from a high-voltage power line in 2020 over 8 days with field levels between about 180 and 1400 nT (1.8 and 14 mG) = factor 7.8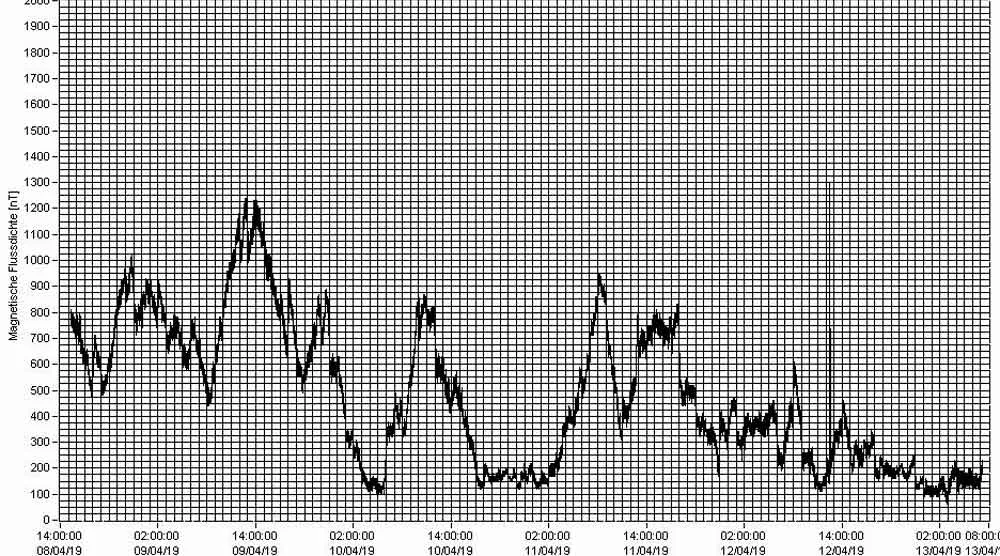
The time course of ELF magnetic field levels from a high-voltage power line in 2019 over 5 days with field levels between about 80 and 1200 nT (0.8 and 12 mG) = factor 15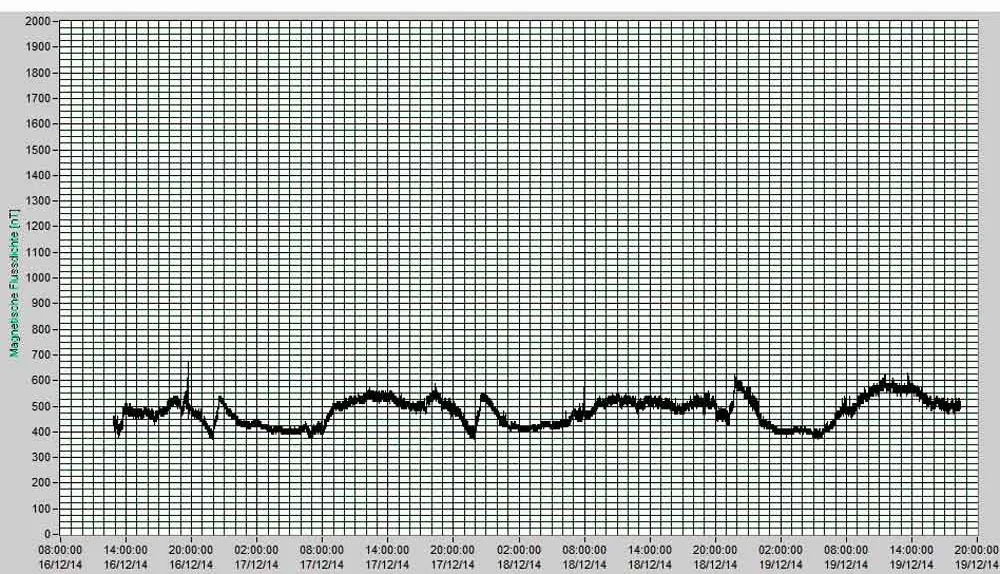
The time course of ELF magnetic field levels at the same high-voltage power line, but at two different times (this example clearly illustrates the new fluctuation patterns of field levels or current flows that produce them): in 2014 for 3 days with field levels between about 380 and 600 nT (3.8 and 6 nT) = factor 1.6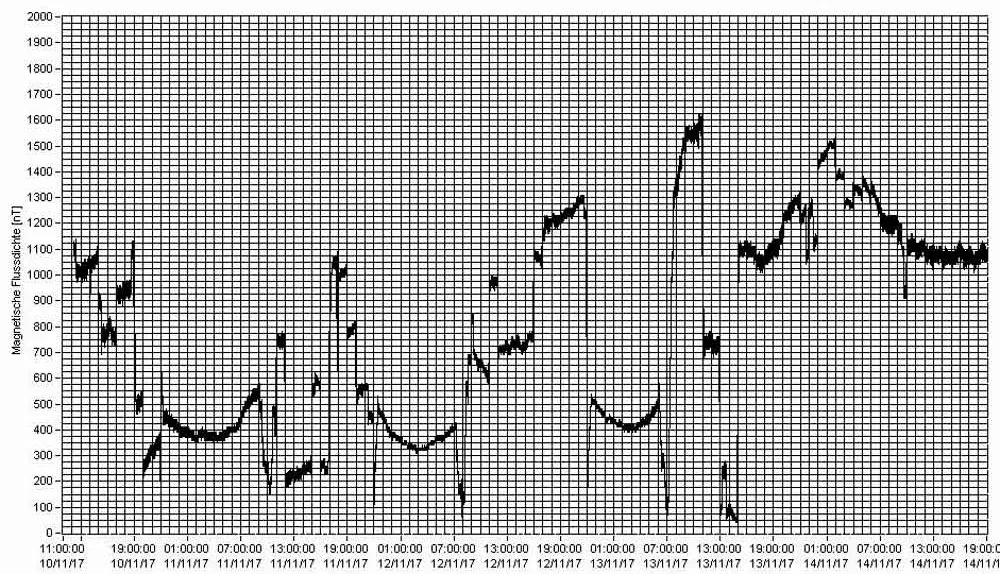
The time course of ELF magnetic field levels at the same high-voltage power line, but at two different times (this example clearly illustrates the new fluctuation patterns of field levels or current flows that produce them): in 2017 for 4 days with field levels between about 50 and 1600 nT (0.5 and 16 mG) = factor 323 The time course of ELF magnetic field levels from a high-voltage power line in 2020 over 8 days with field levels between about 180 and 1400 nT (1.8 and 14 mG) = factor 7.84 The time course of ELF magnetic field levels from a high-voltage power line in 2019 over 5 days with field levels between about 80 and 1200 nT (0.8 and 12 mG) = factor 155 and 6 The time course of ELF magnetic field levels at the same high-voltage power line, but at two different times (this example clearly illustrates the new fluctuation patterns of field levels or current flows that produce them):
Left graph: in 2014 for 3 days with field levels between about 380 and 600 nT (3.8 and 6 nT) = factor 1.6
Right graph: in 2017 for 4 days with field levels between about 50 and 1600 nT (0.5 and 16 mG) = factor 32
Causes of the fluctuations
The energy transition in recent and upcoming years is likely the main reason for the observed fluctuations shown above, which may cause greater biological effects. In the past, electrical power was generated by individual power plants — in Germany, mostly by nuclear and coal-fired power plants — that consistently feed electricity into the grid, which travels along the same routes or transmission lines. Small fluctuations were more likely to result from slight changes on the side of consumption, such as industry and end users. Now large power plants are being shut down. In Germany, nuclear power plants have already been phased out and coal-fired plants are currently being phased out. At the same time, more and more wind and solar power plants are being built, which can only produce electricity intermittently and with fluctuations. As a result, electricity travels along different routes throughout the country. For example, when the wind is blowing in the north, these transmission lines will effectively transport a significant amount of electricity to the southern part of the country. However, in periods of calm winds, the burden of compensating for the energy shortfall will be on foreign nuclear power plants or coal-fired power plants in the western part of the country. This means that current flows and loads are constantly changing and that different high-voltage power lines are constantly switched on and off, all of which results in constantly fluctuating and abruptly changing magnetic field levels. It may even happen that some lines temporarily carry no currents at all and consequently emit no fields.
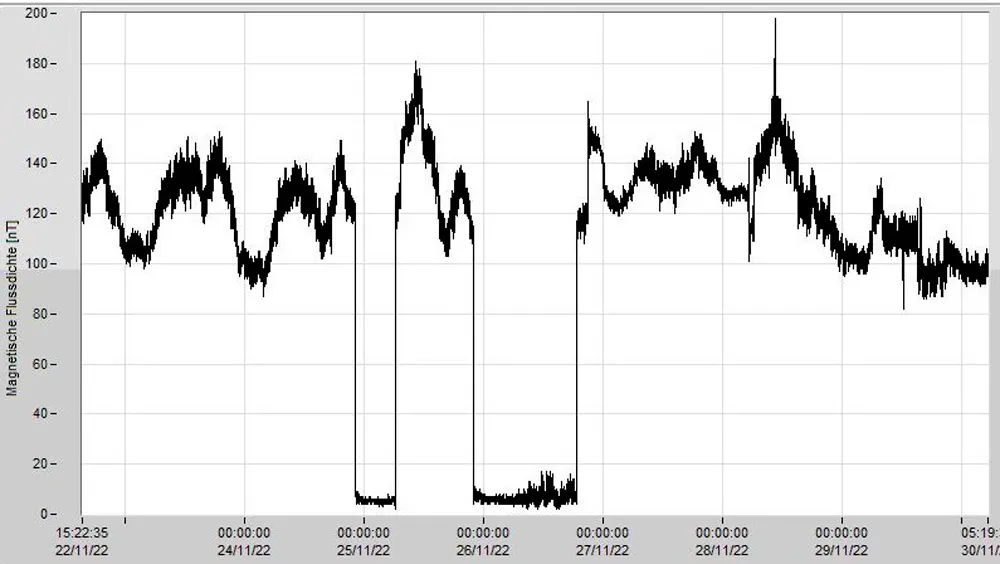
The time course of ELF magnetic field levels from a high-voltage power line in 2022 for 8 days, showing two periods without any fields7 The time course of ELF magnetic field levels from a high-voltage power line in 2022 for 8 days, showing two periods without any fields
Challenging measurements
The changes mentioned above have now made it harder to measure and assess ELF magnetic fields from high-voltage power lines compared to before. It has always been advisable to carry out long-term measurements for at least two to three days. In many cases, this is clearly not sufficient anymore. Today we need long-term measurements over at least seven days; otherwise, we run the risk of significantly under- or overestimating exposure levels.
If there was even the slightest doubt or a need for maximum safety, or if the results were close to the target threshold level, the measurements should be repeated after several weeks or months, ideally under different weather conditions or during different seasons. It is very helpful, but not always possible, to receive or obtain the load information for the time of the measurements from the utility company or transmission line operator.
Every building biology testing specialist should be aware of this issue of strongly fluctuating ELF magnetic fields and be able to communicate this to their clients to avoid measurement and assessment errors.
High-voltage direct current transmission lines (HVDC)
In the future, HVDC transmission lines will be reality: they do not exist in Germany just yet, but are currently in the planning and construction phase. The transition of our energy supply leads to innovations. Because more and more electricity is produced by wind power in the north, respective transmission lines must be available to distribute this electricity across the rest of the country. Three new large north–south corridors are planned. The new transmission lines will primarily be installed underground, but often also overhead. They are not expected to be put into operation before 2025.
These new transmission lines will not always use alternating current (AC, at a frequency of 50 Hertz) as before, but direct current (DC) like streetcar systems or photovoltaic systems.
This raises the question of what exposure levels of static magnetic fields we can expect near direct current transmission lines. The German Federal Office for Radiation Protection expects:
“It is currently assumed that static magnetic field levels in the immediate vicinity of HVDC transmission corridors will be at about the same level as the naturally occurring Earth’s magnetic field. In Germany, the Earth’s magnetic field has a magnetic flux density of about 45 microtesla (µT). We have rather little information on the electric field levels of HVDC overhead transmission lines at this time; however, no exposure limits apply to them because static electric fields are not known to cause any direct health effects.”
For static magnetic fields, on the other hand, an exposure limit has already been set at 500 µT (26th Federal Pollution Control Regulation), which is about ten times higher than the naturally occurring Earth’s magnetic field (also a static magnetic field) and clearly above the relevant Building Biology Evaluation Guideline values for temporal fluctuations: less than 1 µT = no anomaly, 1 to 2 µT = slight anomaly, 2 to 10 µT = severe anomaly, and above 10 µT = extreme anomaly.
Naturally, we don’t have experience with measuring electromagnetic fields near HVDC transmission lines yet, making it difficult to assess exposure levels based on comparisons with streetcar systems. In the latter systems, current flows are much lower and field levels constantly change abruptly by the second because of widespread net currents.
Based on theoretical calculations, static magnetic field levels within 5 to 50 meters of HVDC transmission lines could be about 1 to 20 µT. Ultimately, only actual measurements, especially long-term measurements, will reveal the extent of residents’ exposure, the intensity and variability of field levels, and any potential health effects.
This is a translation of “Hochspannungsleitungen und Elektrosmog – was ist neu?“
Author
Dr. Manfred Mierau is a biologist (Diplom-Biologe) and works as a Building Biology Professional in Aachen, Germany.
Translator
Katharina Gustavs is a Building Biology Professional in Victoria, Canada, who translated the Building Biology Online Course IBN.
info@katharinaconsulting.com
katharinaconsulting.com
Ihre Stimme zählt
Wir sind neugierig darauf, was Sie zu sagen haben. Hier ist Raum für Ihre Meinung, Erfahrung, Stellungnahme oder ergänzende Informationen. Wir bitten Sie um Verständnis, dass auf dieser kostenlosen Informationsplattform:
- Fragen nicht beantworten werden können – bitte stellen Sie Ihre Fragen direkt an unsere Autor*innenAutor*innen.
- Werbung nicht gestattet ist – Sie können aber gerne mit einem Werbebanner auf Ihre Produkte/Dienstleistungen aufmerksam machen
Quellenangaben und/oder Fußnoten:

Wie werde ich
Baubiolog*in IBN?

How to become a Building Biology Consultant IBN?
Nachhaltig weiterbilden
Know-how, Zusatzqualifikationen und neue berufliche Möglichkeiten für Baufachleute sowie alle, die sich für gesundes, nachhaltiges Bauen und Wohnen interessieren.
Unser Kompetenz-Netzwerk
Hier finden Sie unsere qualifizierten Baubiologischen Beratungsstellen und Kontakte im In- und Ausland nach Standort und Themen sortiert.
Über die Baubiologie
Die Baubiologie beschäftigt sich mit der Beziehung zwischen Menschen und ihrer gebauten Umwelt. Wie wirken sich Gebäude, Baustoffe und Architektur auf Mensch und Natur aus? Dabei werden ganzheitlich gesundheitliche, nachhaltige und gestalterische Aspekte betrachtet.
25 Leitlinien
Für einen schnellen, aufschlussreichen Überblick haben wir in 25 Leitlinien der Baubiologie die wichtigsten Parameter herausgearbeitet, sortiert und zusammengefasst. In 15 Sprachen, als PDF oder als Plakat erhältlich.


0 Kommentare